The Grange Golf Course
Auckland · 14 greens mapped
Read these greens →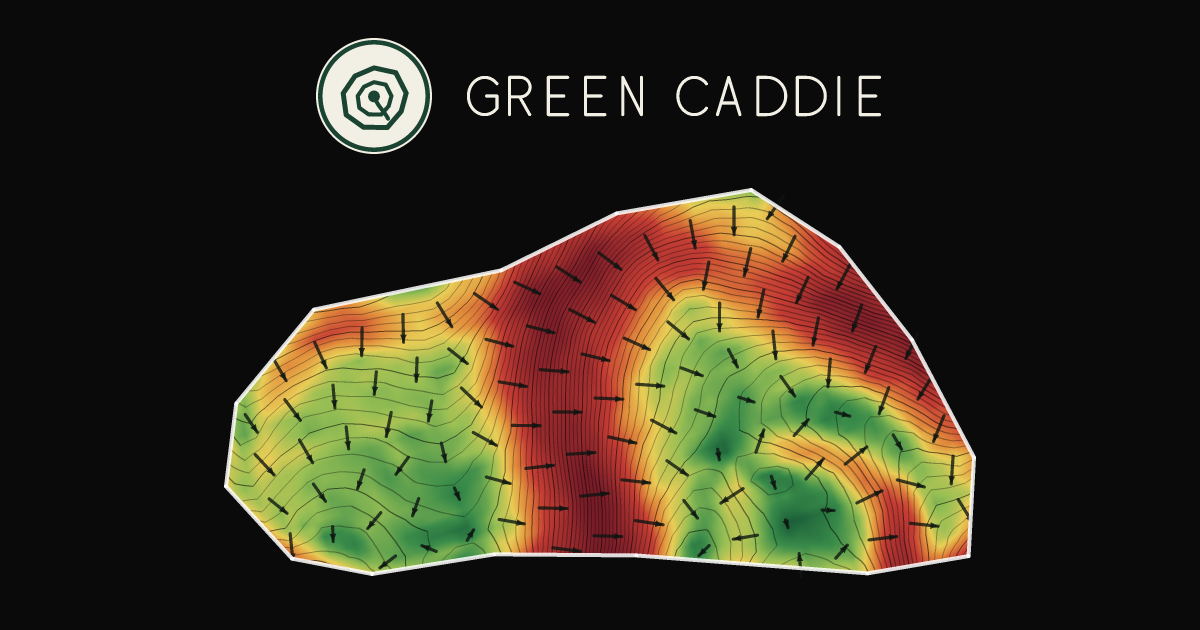
The greens here
14 greens at The Grange have been mapped from the national LiDAR survey — 7,841 m² of putting surface altogether, with a median green of 520 m². The national median is 397 m², so these run 31% larger than average.
- Steepest green: hole 2t, averaging 5.2% and falling west.
- Flattest green: green a, at 1.0%.
- Most internal fall: hole 2t, 2.01 m between its low and high point.
- Largest green: hole 5t, 1055 m².
Every green
| Green | Size | Fall | Avg grade | Runs off to the |
|---|---|---|---|---|
| Hole 1G | 469 m² | 0.90 m | 2.9% | north |
| Hole 2G | 425 m² | 0.82 m | 2.2% | north |
| Hole 2T | 429 m² | 2.01 m | 5.2% | west |
| Hole 3G | 424 m² | 0.96 m | 1.4% | north-east |
| Hole 3T | 521 m² | 0.71 m | 1.2% | east |
| Hole 4G | 444 m² | 0.58 m | 1.2% | north-east |
| Hole 4T | 601 m² | 1.77 m | 3.9% | north-west |
| Hole 5G | 518 m² | 1.16 m | 1.4% | north-west |
| Hole 5T | 1055 m² | 1.27 m | 2.3% | south-west |
| Hole 6G | 571 m² | 0.89 m | 1.3% | east |
| Hole 7G | 967 m² | 1.46 m | 4.5% | north |
| Hole 8G | 559 m² | 0.84 m | 2.6% | north-east |
| Hole 9G | 698 m² | 1.63 m | 4.0% | south-east |
| Green A | 162 m² | 0.33 m | 1.0% | north |
“Fall” is the height difference between the lowest and highest point of the putting surface. “Avg grade” is the best-fit plane across it — a green can average 2% and still have a shelf on it, which is what the app shows and a table cannot.
Where these numbers come from
Heights come from Land Information New Zealand’s 1 m LiDAR elevation survey (Auckland Part 1, 2024), published openly under CC BY 4.0. Green outlines and hole numbers come from OpenStreetMap under the Open Database Licence. Slope uncertainty on this course works out at ±0.15%.
Slope is measured. Break is modelled — the read in the app is a physics simulation of a ball rolling over the measured surface, and it knows nothing about grain or moisture. The survey predates any green rebuilt since 2024. More about how this is made.