Tinwald Goft Club
Canterbury · 18 greens mapped
Read these greens →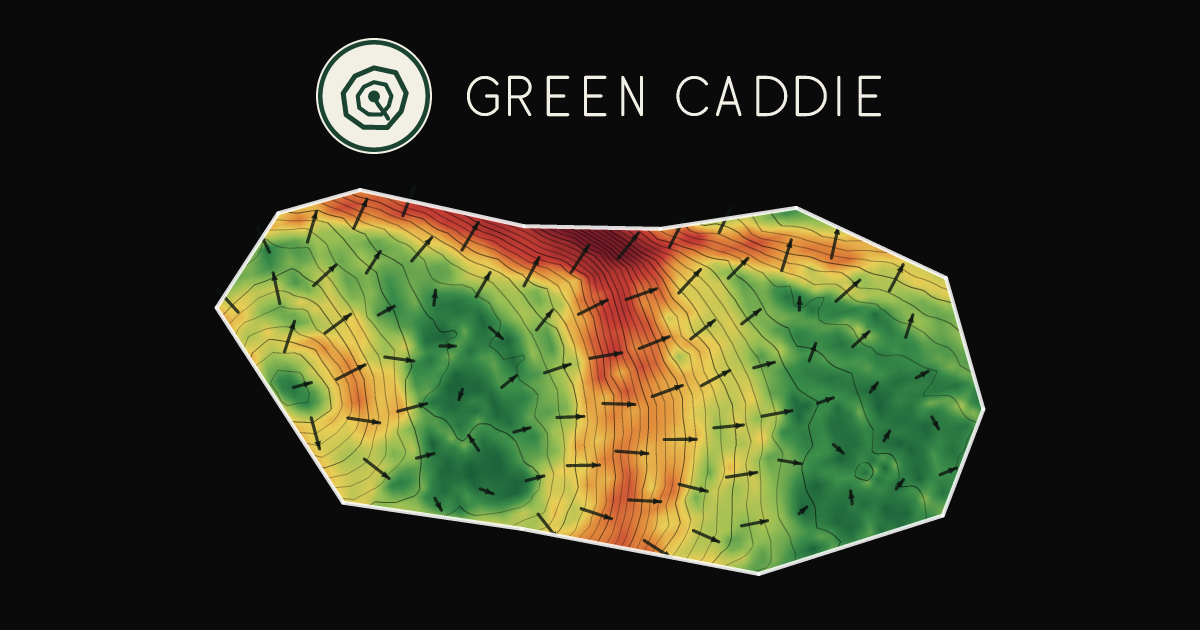
The greens here
18 greens at Tinwald Goft Club have been mapped from the national LiDAR survey — 7,481 m² of putting surface altogether, with a median green of 410 m². That is within a few percent of the national median of 397 m² — typical for New Zealand.
- Steepest green: green r, averaging 3.3% and falling south.
- Flattest green: green b, at 0.2%.
- Most internal fall: green d, 1.07 m between its low and high point.
- Largest green: green e, 539 m².
Every green
| Green | Size | Fall | Avg grade | Runs off to the |
|---|---|---|---|---|
| Green A | 446 m² | 0.36 m | 1.1% | south-west |
| Green B | 390 m² | 0.24 m | 0.2% | west |
| Green C | 322 m² | 0.28 m | 0.8% | north-west |
| Green D | 463 m² | 1.07 m | 3.2% | north |
| Green E | 539 m² | 1.06 m | 3.2% | south |
| Green F | 441 m² | 0.89 m | 2.5% | west |
| Green G | 390 m² | 0.60 m | 2.2% | south-west |
| Green H | 527 m² | 0.72 m | 2.4% | south |
| Green I | 370 m² | 0.51 m | 1.5% | south-east |
| Green J | 429 m² | 1.02 m | 2.4% | north-west |
| Green K | 460 m² | 0.26 m | 0.7% | south-east |
| Green L | 473 m² | 0.42 m | 1.1% | south |
| Green M | 361 m² | 0.51 m | 1.5% | east |
| Green N | 359 m² | 0.36 m | 1.2% | east |
| Green O | 389 m² | 0.27 m | 0.7% | south-west |
| Green P | 384 m² | 0.37 m | 1.2% | east |
| Green Q | 438 m² | 0.34 m | 0.7% | south-east |
| Green R | 301 m² | 0.73 m | 3.3% | south |
“Fall” is the height difference between the lowest and highest point of the putting surface. “Avg grade” is the best-fit plane across it — a green can average 2% and still have a shelf on it, which is what the app shows and a table cannot.
Where these numbers come from
Heights come from Land Information New Zealand’s 1 m LiDAR elevation survey (Canterbury, 2018-2019), published openly under CC BY 4.0. Green outlines and hole numbers come from OpenStreetMap under the Open Database Licence. Slope uncertainty on this course works out at ±0.15%.
Slope is measured. Break is modelled — the read in the app is a physics simulation of a ball rolling over the measured surface, and it knows nothing about grain or moisture. The survey predates any green rebuilt since 2019. More about how this is made.